Home Educational Effectiveness
Graduation Rates (%)
|
Writing |
WCYA |
Visual Art |
Music Comp |
Graphic Design |
Film |
MAT/ MA |
W&P |
Int’l MFA |
AVG |
| 2008 |
92 |
79 |
100 |
|
|
|
|
|
|
90 |
| 2009 |
91 |
89 |
100 |
|
|
|
|
|
|
92 |
| 2010 |
86 |
97 |
85 |
|
|
|
|
|
|
89 |
| 2011 |
88 |
79 |
95 |
100 |
88 |
|
|
|
|
90 |
| 2012 |
87 |
89 |
88 |
100 |
86 |
|
|
|
|
90 |
| 2013 |
91 |
88 |
100 |
100 |
100 |
100 |
|
|
|
94 |
| 2014 |
97 |
89 |
80 |
100 |
100 |
85 |
|
|
|
93 |
| 2015 |
71 |
95 |
91 |
100 |
82 |
70 |
75 |
86 |
|
84 |
| 2016 |
75 |
72 |
91 |
80 |
67 |
90 |
77 |
73 |
|
77 |
| 2017 |
83 |
89 |
85 |
100 |
66 |
88 |
91 |
94 |
|
87 |
| 2018 |
76 |
100 |
92 |
80 |
100 |
86 |
100 |
80 |
57 |
96 |
| 2019 |
94 |
88 |
82 |
100 |
80 |
70 |
100 |
100 |
80 |
86 |
Retention Rates by Program (%)
|
Writing |
WCYA |
Visual Art |
Music Comp |
Graphic Design |
Film |
MAT/ MA |
W&P |
Int’l MFA |
AVG |
| 2008 |
92 |
79 |
100 |
|
|
|
|
|
|
90 |
| 2009 |
91 |
84 |
100 |
|
|
|
|
|
|
91 |
| 2010 |
91 |
97 |
85 |
|
|
|
|
|
|
92 |
| 2011 |
97 |
100 |
95 |
93 |
100 |
|
|
|
|
97 |
| 2012 |
97 |
97 |
94 |
100 |
100 |
|
|
|
|
97 |
| 2013 |
98 |
96 |
100 |
100 |
100 |
100 |
|
|
|
99 |
| 2014 |
97 |
93 |
90 |
100 |
100 |
85 |
|
|
|
95 |
| 2015 |
97 |
100 |
100 |
100 |
100 |
100 |
100 |
86 |
|
99 |
| 2016 |
94 |
93 |
91 |
100 |
89 |
100 |
100 |
82 |
|
94 |
| 2017 |
97 |
89 |
100 |
80 |
83 |
88 |
91 |
89 |
|
92 |
| 2018 |
79 |
100 |
100 |
100 |
100 |
100 |
100 |
80 |
100 |
92 |
| 2019 |
100 |
96 |
91 |
100 |
80 |
96 |
100 |
100 |
100 |
96 |
| 2020 |
100 |
96 |
100 |
100 |
100 |
86 |
n/a |
25 |
n/a |
93 |
| 2021 |
97 |
87 |
67 |
89 |
78 |
67 |
n/a |
n/a |
n/a |
86 |
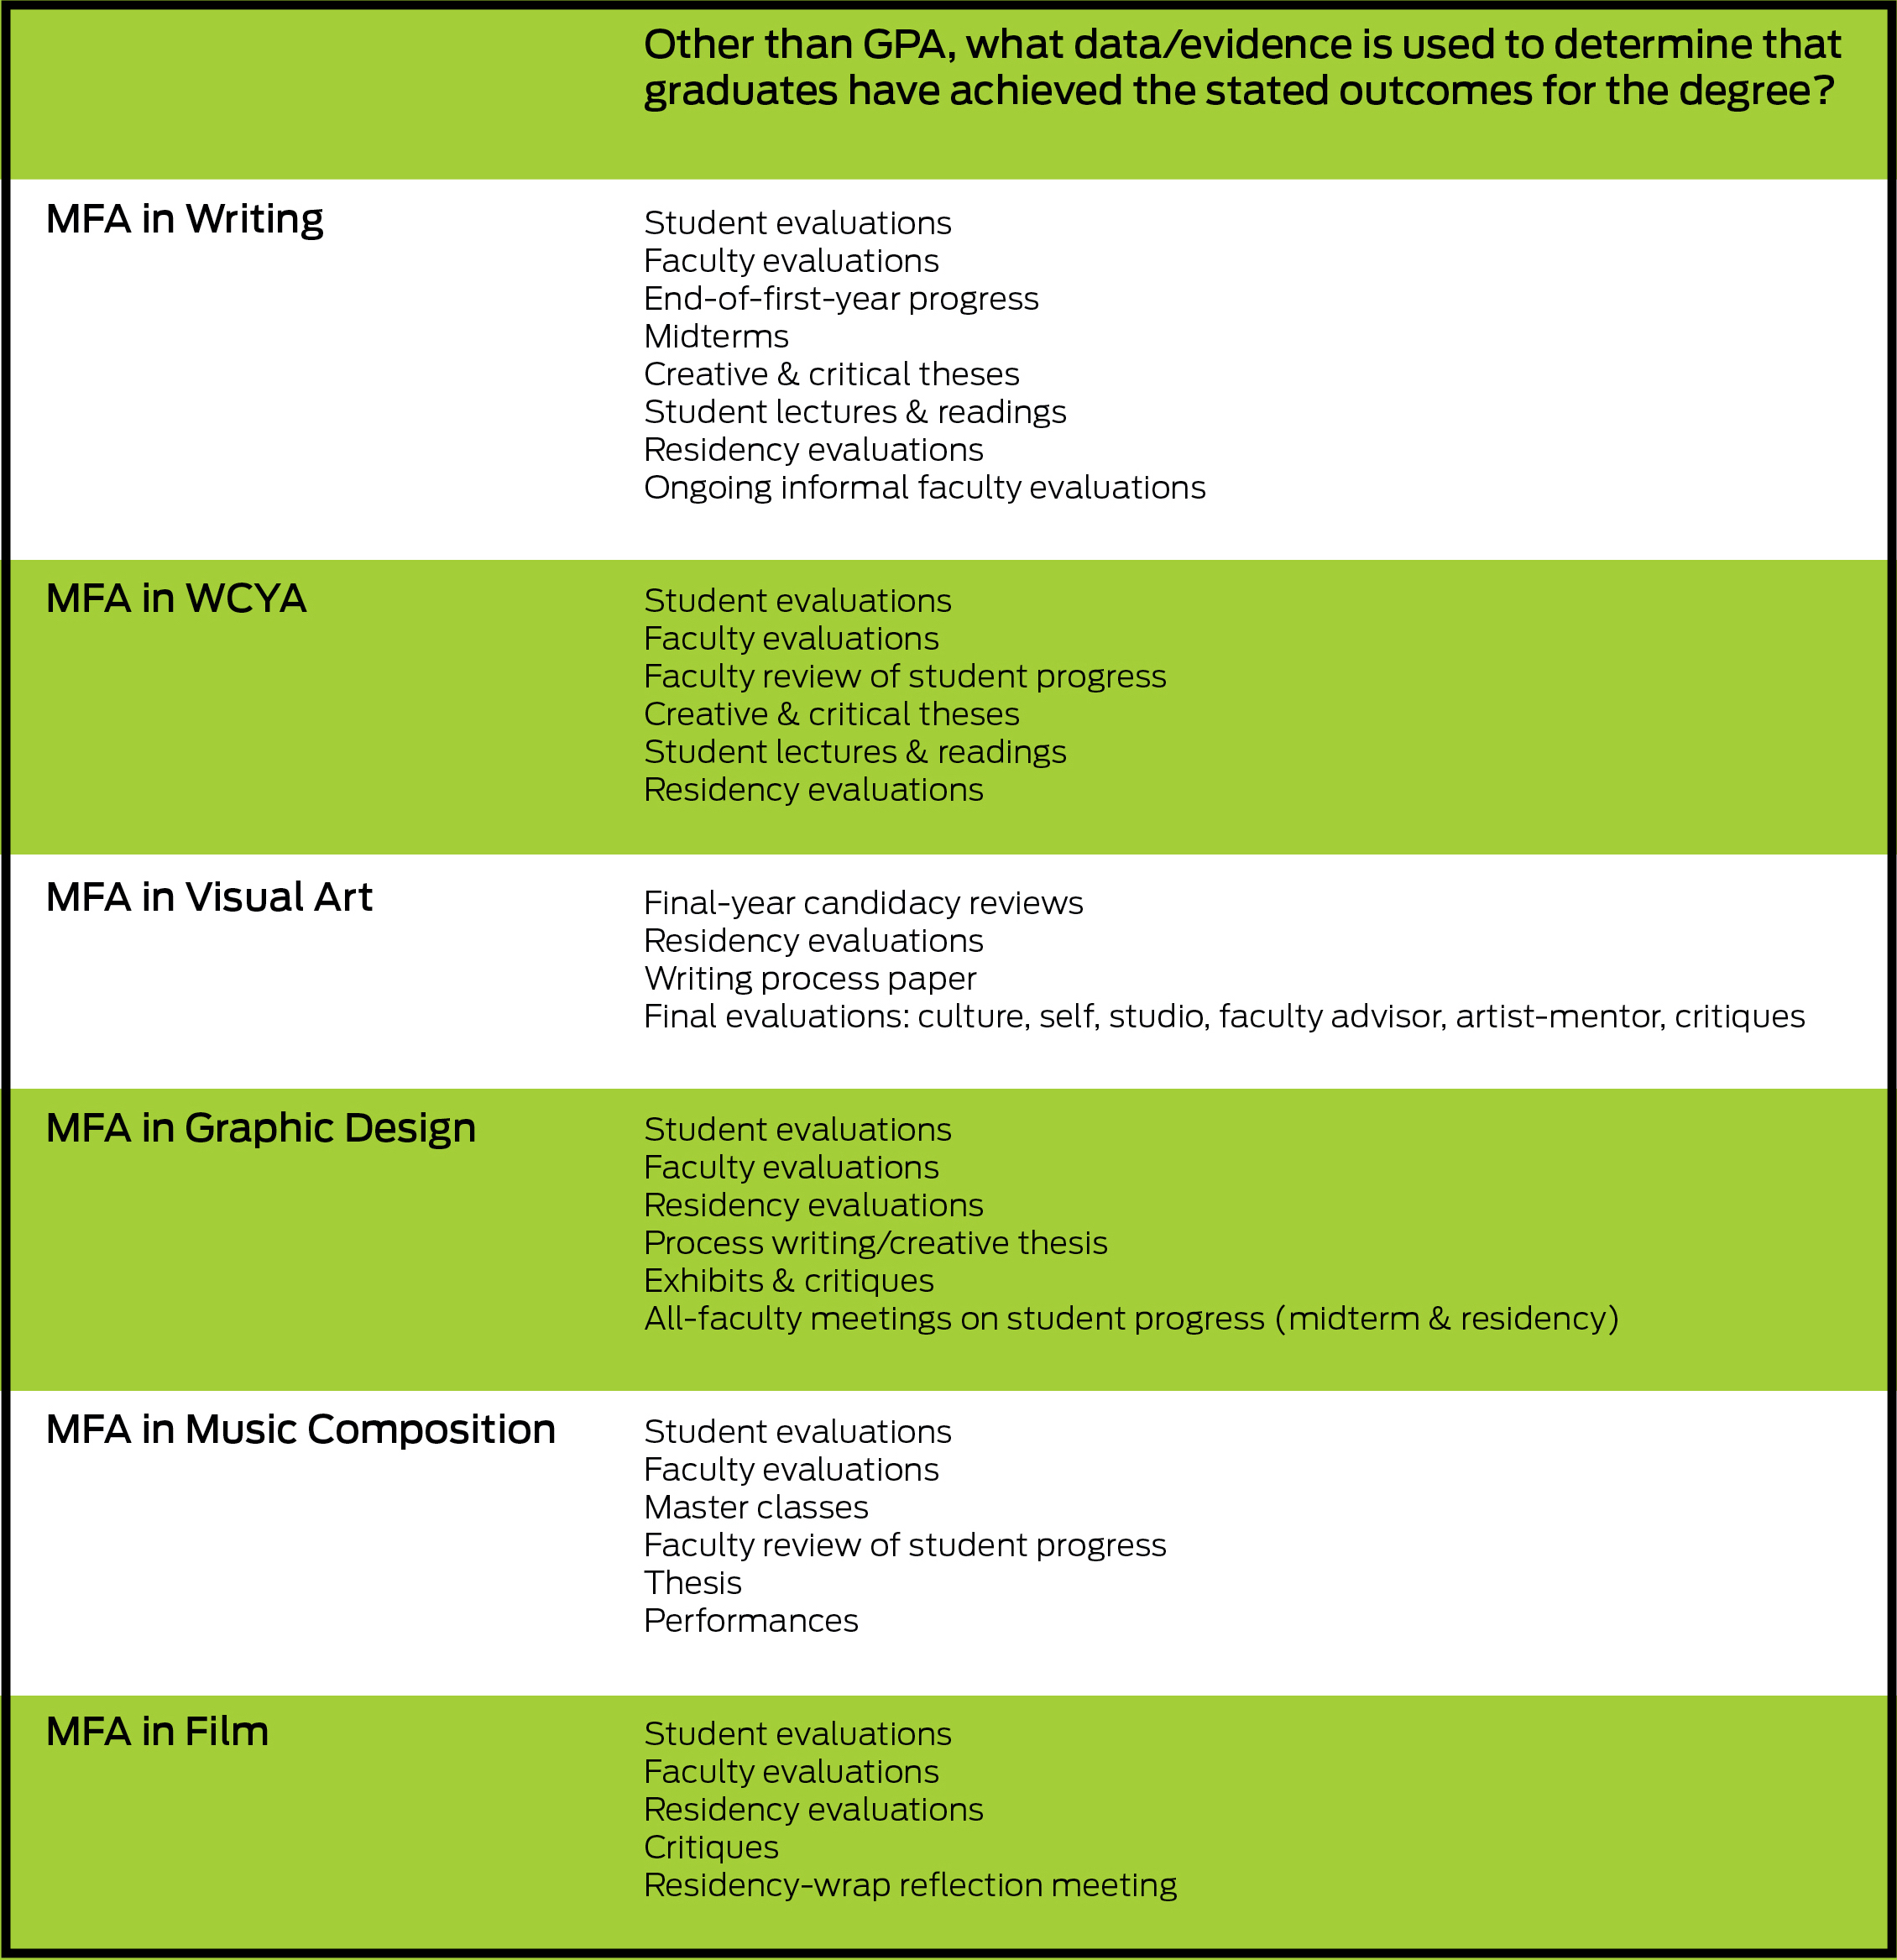
Student Success Indicators
- Measures of student success vary by individual program, based on each program’s unique structure.
- Formal learning outcomes have been developed for all programs.
- These learning outcomes are published in student handbooks and program brochures.